Benchmarks
Methodology
Total data: 4,903 benchmark runs (3,703 relay throughput + 480 latency + 720 tunnel quality).
- Traffic generator: custom distributed bench tool
(
derp_scale_test), 20 DERP peers across 4 client VMs, 10 sender/receiver pairs, ~1400-byte messages at WireGuard MTU, token-bucket pacing - Duration: 15 seconds per run (3s warmup, 12s measured)
- Runs: 20 per data point, 95% CIs (Welch's t)
- Latency:
derp_test_clientping/echo, 5,000 samples per run, 2.16M total samples - Tunnel quality: iperf3 UDP + TCP + ICMP through WireGuard/Tailscale, 20 runs per point
Software
| Component | Version |
|---|---|
| Hyper-DERP | kTLS (TLS 1.3 AES-GCM), io_uring DEFER_TASKRUN |
| Go derper | v1.96.4, go1.26.1, release build |
| Kernel | 6.12.73+deb13-cloud-amd64 |
Infrastructure
| Role | Machine Type | Count | NIC BW |
|---|---|---|---|
| Relay | c4-highcpu-16 | 1 | 22 Gbps |
| Client | c4-highcpu-8 | 4 | 22 Gbps each |
GCP europe-west4-a. NIC bandwidth verified at 22 Gbps on all paths.
Peak Throughput
| Config | HD Peak (Mbps) | TS Ceiling (Mbps) | HD/TS |
|---|---|---|---|
| 2 vCPU (1w) | 3,730 | 1,870 | 10.8x |
| 4 vCPU (2w) | 6,091 | 2,798 | 3.5x |
| 8 vCPU (4w) | 12,316 | 4,670 | 2.7x |
| 16 vCPU (8w) | 16,545 | 7,834 | 2.1x |
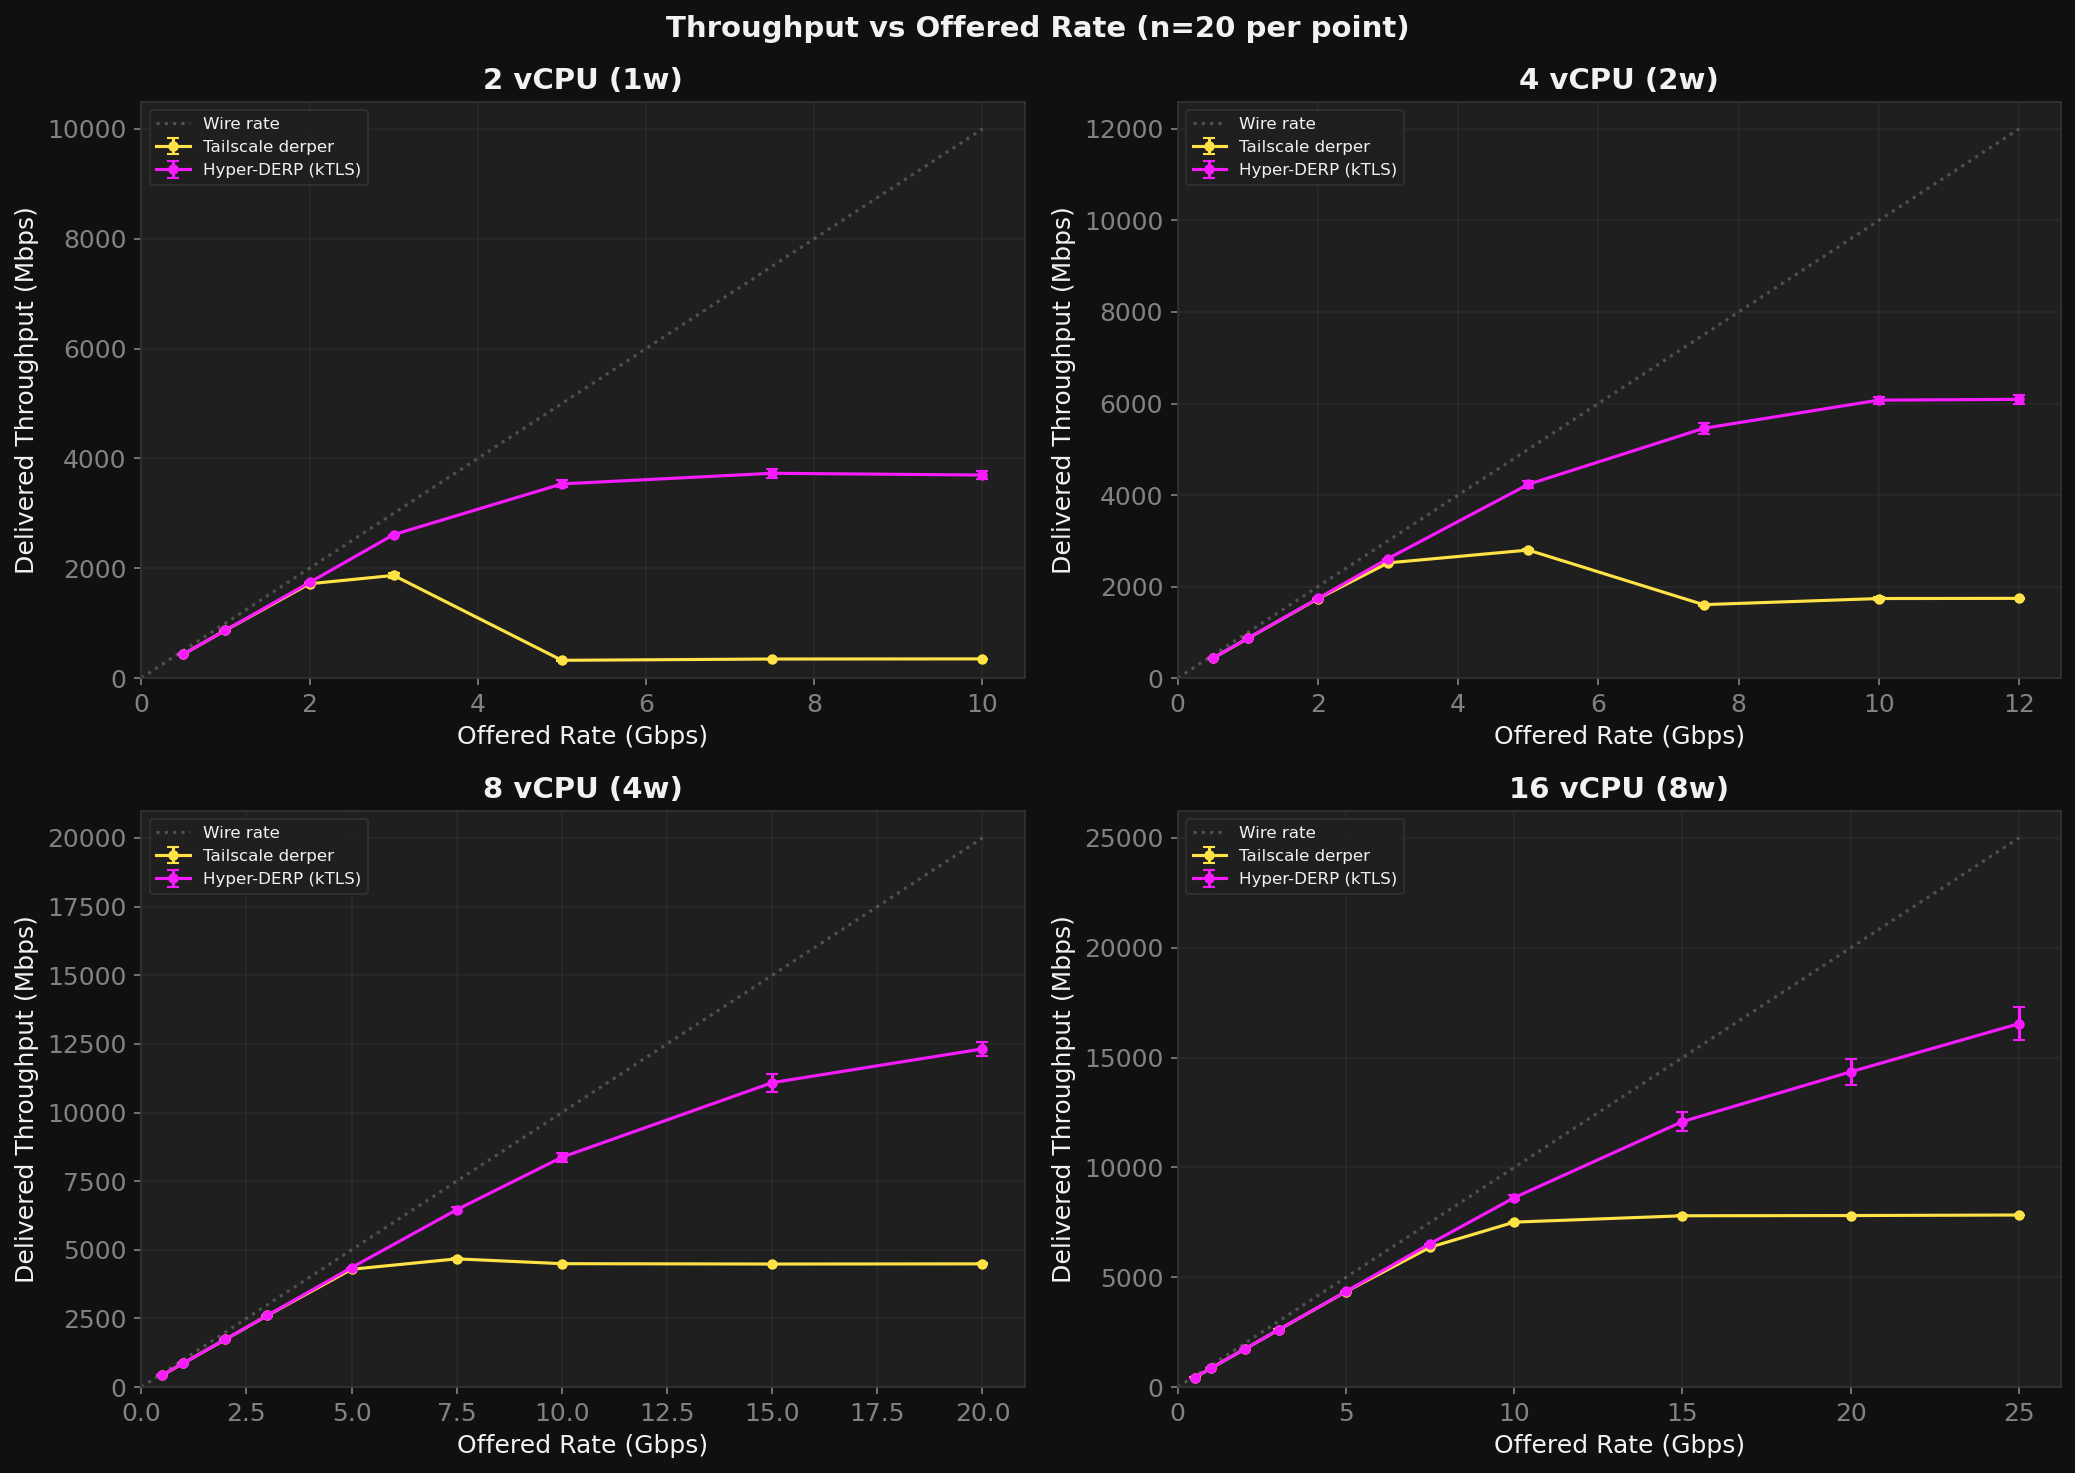
HD's advantage grows as resources shrink. At 2 vCPU, TS collapses (92% loss at 5G offered) while HD delivers 3.5 Gbps.
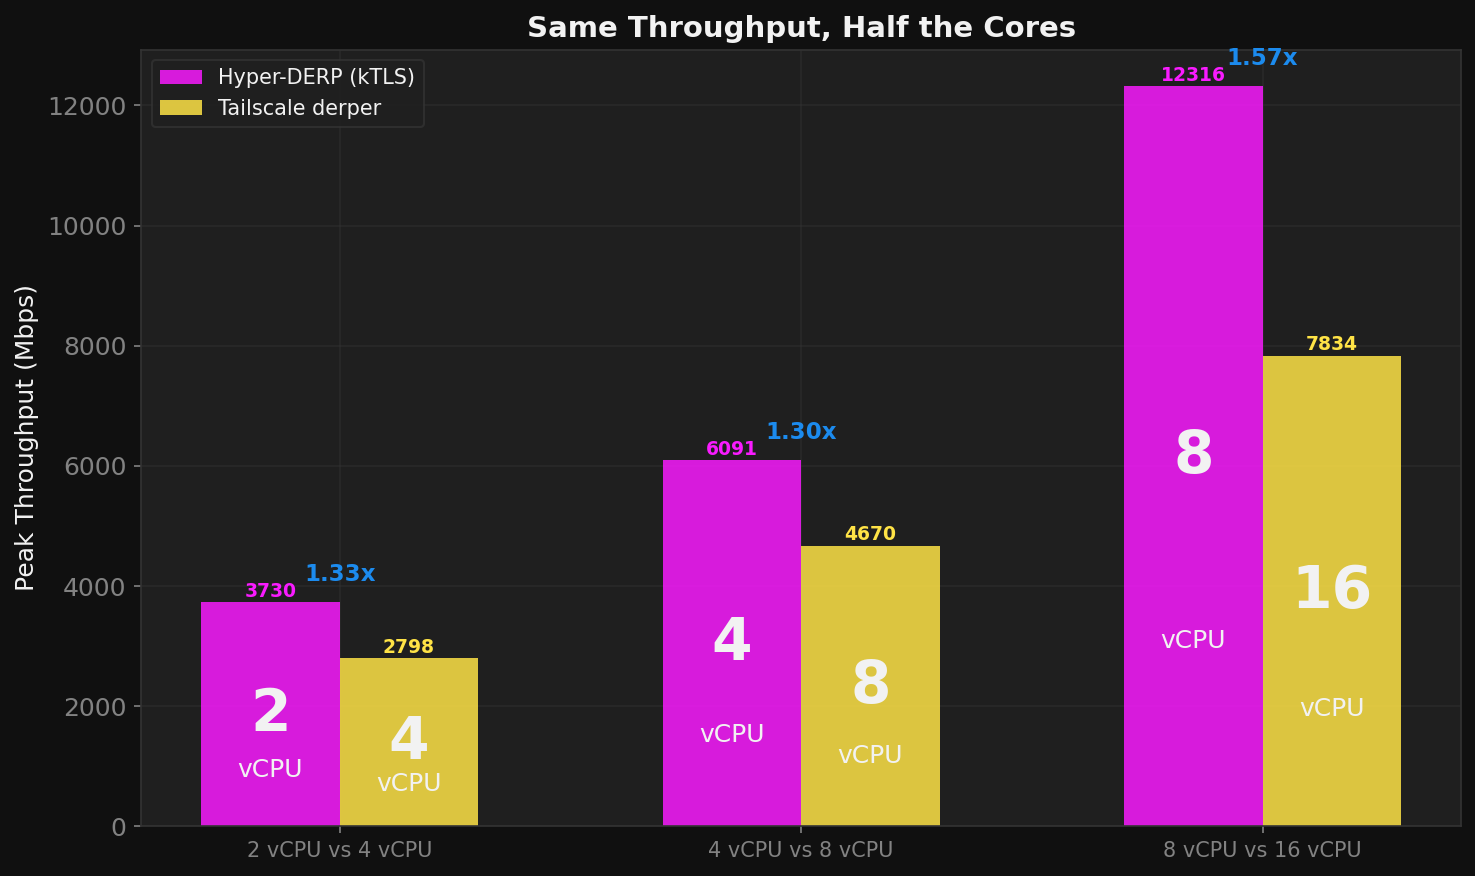
The Cost Story
HD delivers the same throughput on half the vCPUs:
| TS deployment | TS throughput | HD equivalent | HD throughput | Savings |
|---|---|---|---|---|
| TS on 16 vCPU | 7,834 Mbps | HD on 8 vCPU | 8,371 Mbps | 2x |
| TS on 8 vCPU | 4,670 Mbps | HD on 4 vCPU | 5,457 Mbps | 2x |
| TS on 4 vCPU | 2,798 Mbps | HD on 2 vCPU | 3,536 Mbps | 2x |
Full methodology, raw data, and tooling are in the benchmark repository.