Peer Scaling
Methodology
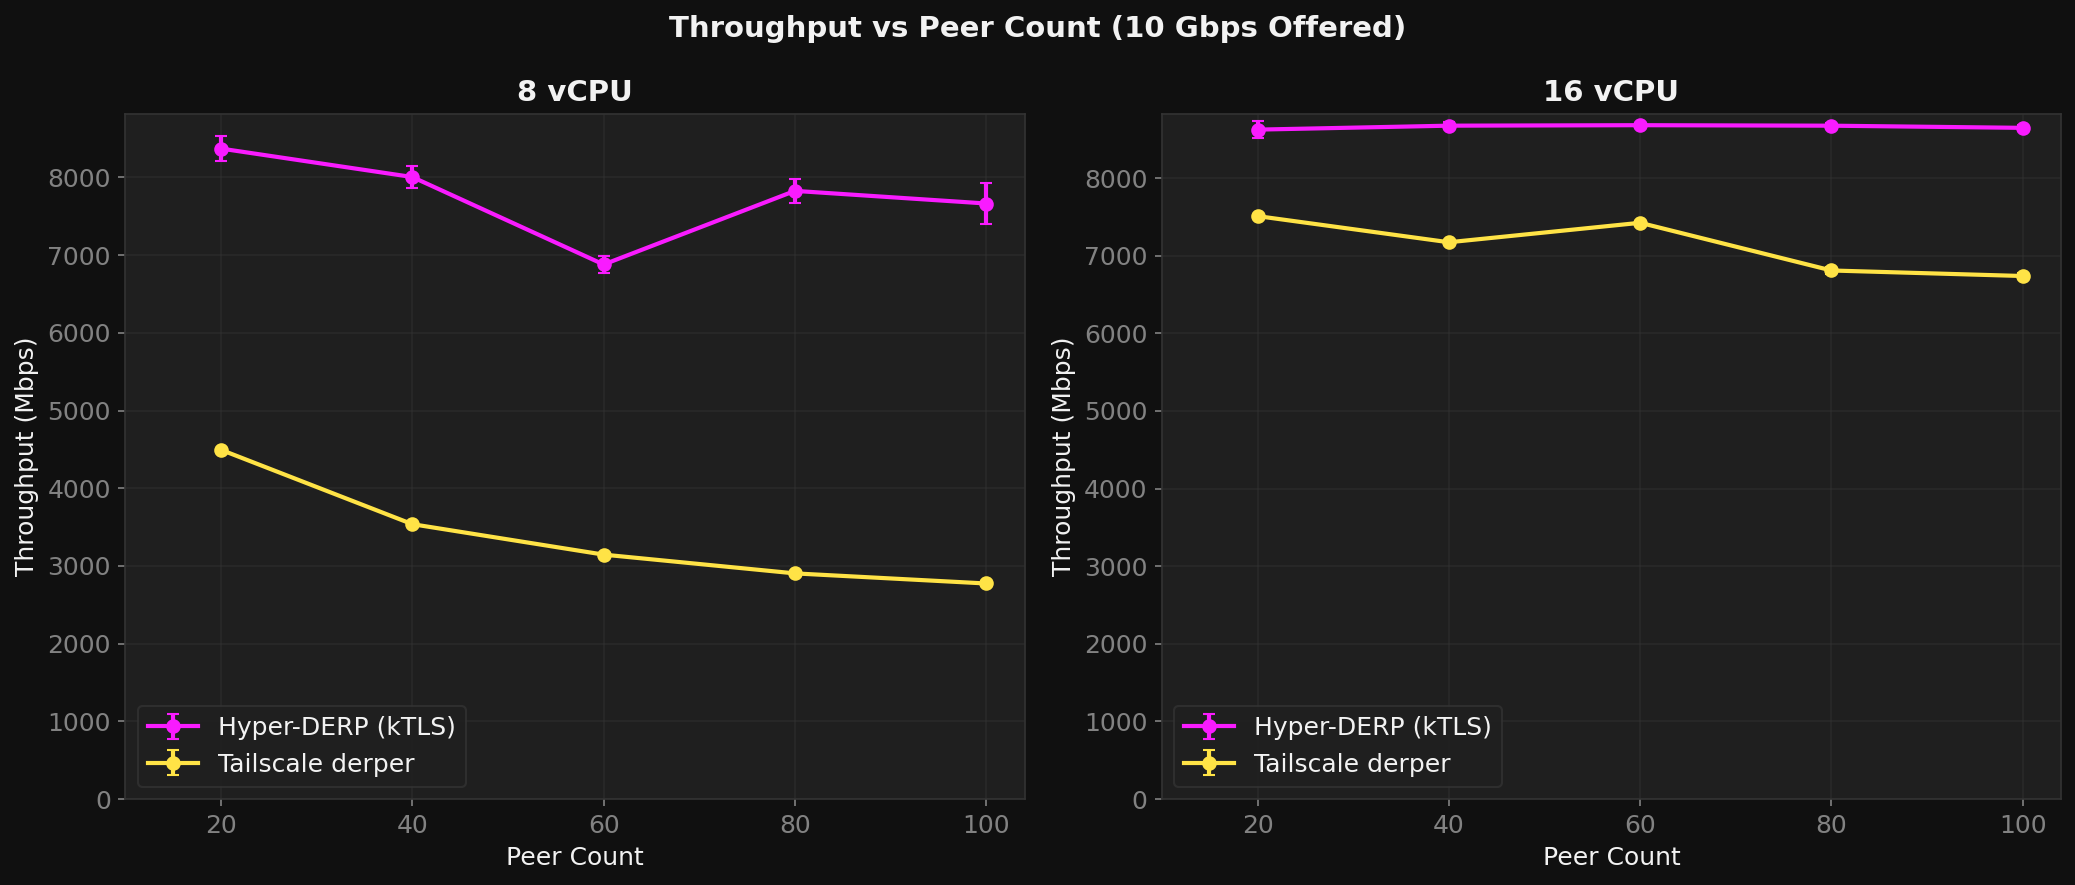
Same distributed bench tool as the throughput test, with varying peer counts: 20, 40, 60, 80, 100 peers (10--50 active pairs). Pre-generated pair files ensure cross-VM placement. 10--20 runs per data point.
Results (8 vCPU, 10G offered)
| Peers | HD (Mbps) | HD Loss | TS (Mbps) | TS Loss | HD/TS |
|---|---|---|---|---|---|
| 20 | 8,371 | 0.1% | 4,495 | 44% | 1.9x |
| 40 | 8,006 | 0.5% | 3,538 | 57% | 2.3x |
| 60 | 6,880 | 0.7% | 3,146 | 63% | 2.2x |
| 80 | 7,827 | 0.4% | 2,905 | 66% | 2.7x |
| 100 | 7,665 | 0.5% | 2,775 | 68% | 2.8x |
TS loses 38% throughput and gains 24 percentage points of loss going from 20 to 100 peers. HD stays flat. The ratio amplifies from 1.9x to 2.8x.
Why
TS creates 2 goroutines per peer. At 100 peers = 200 goroutines competing for CPU, plus scheduling overhead and cache pressure from goroutine stack switches.
HD's sharded hash table is O(1) per peer regardless of count. Each worker owns a disjoint peer set -- adding peers doesn't increase contention.
Worker Optimization
HD's --workers flag controls io_uring thread count.
Optimal values by config:
16 vCPU
| Rate | 4w | 6w | 8w | 10w | 12w |
|---|---|---|---|---|---|
| 10G | 8,425 | 8,462 | 8,624 | 8,706 | 8,660 |
| 15G | 11,118 | 10,620 | 12,088 | 12,311 | 12,106 |
| 20G | 11,487 | 11,908 | 14,354 | 14,673 | 14,950 |
| 25G | 11,890 | 12,106 | 16,545 | 16,083 | 15,836 |
8 vCPU
| Rate | 2w | 3w | 4w | 6w |
|---|---|---|---|---|
| 5G | 4,182 | 4,352 | 4,353 | 4,352 |
| 10G | 5,121 | 7,021 | 8,371 | 8,272 |
| 15G | 5,152 | 7,315 | 11,087 | 9,966 |
Rule of thumb: workers = vCPUs / 2. Higher peer counts make more workers viable by improving hash distribution.